Chart Overview
👤 This documentation is intended for SQL Users. Discovery Users looking for steps on how to create a chart without SQL can refer to the Data Discovery documentation page.
Charts are the individual objects on dashboards and are often a type of diagram or graph. They are used to create visualizations based on queries resulting in a set of numerical or qualitative data.
<div><UL>
<LI><a href="#SearchChart">Searching for a Chart</a></LI>
<LI><a href="#CreateChart">Creating a Chart</a></LI>
<LI><a href="#ChangeTitle">Changing Chart Titles</a></LI>
<LI><a href="#AddDescription">Adding a Description</a></LI>
<LI><a href="#CopyData">Copying Chart Data</a></LI>
<LI><a href="#DeleteChart">Deleting a Chart</a></LI>
<LI><a href="#CopyChart">Duplicating a Chart</a></LI>
<LI><a href="#MoveChart">Moving a Chart to Another Dashboard</a></LI>
<LI><a href="#ChartLimits">Chart Limits</a></LI>
<LI><a href="#CancelQuery">Canceling a Query</a></LI>
</UL></div>
<HR>
<a name="SearchChart"></a>
<a name="CreateChart"></a>
Searching for a Chart
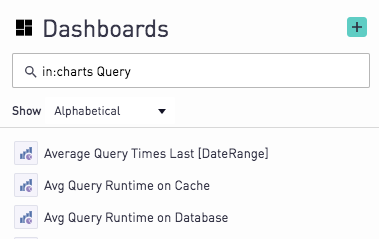
To search for existing charts, users can type in:charts in the dashboard search bar. Typing out in:charts will list all charts available to the user. Typing out keywords after in:charts will return charts with names that contain the searched word.
Creating a Chart
To get started with making charts, click the "New Chart" button in the upper right of the dashboard.
.png)
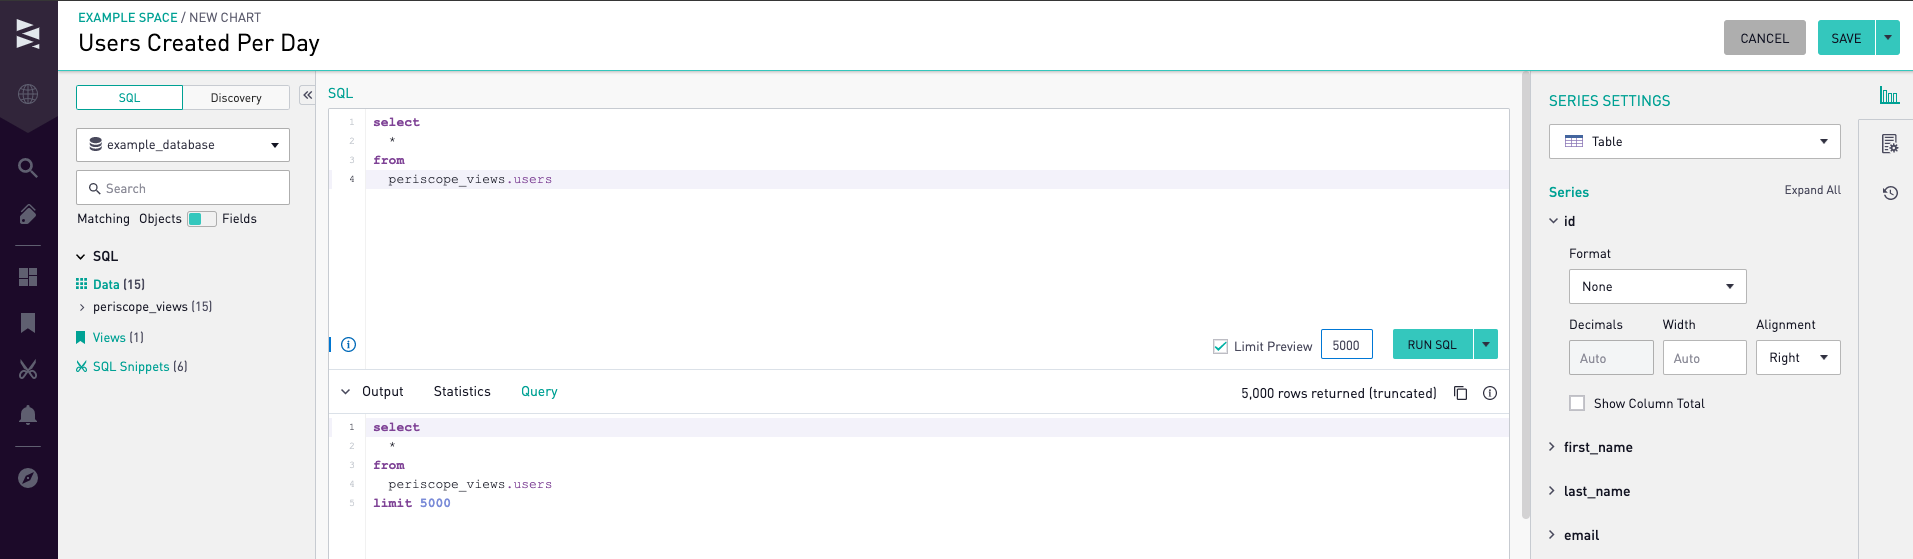
This will open the Chart Editor for a new, untitled chart.
To explore options for what data to analyze, the Schema layout on the left provides a list of the available tables and columns to query from. The dropdown menu at the top of the schema viewer can be used to set the chart to run against a different database and show the tables and columns for that database. More information on the schema viewer and how to navigate it can be found here.
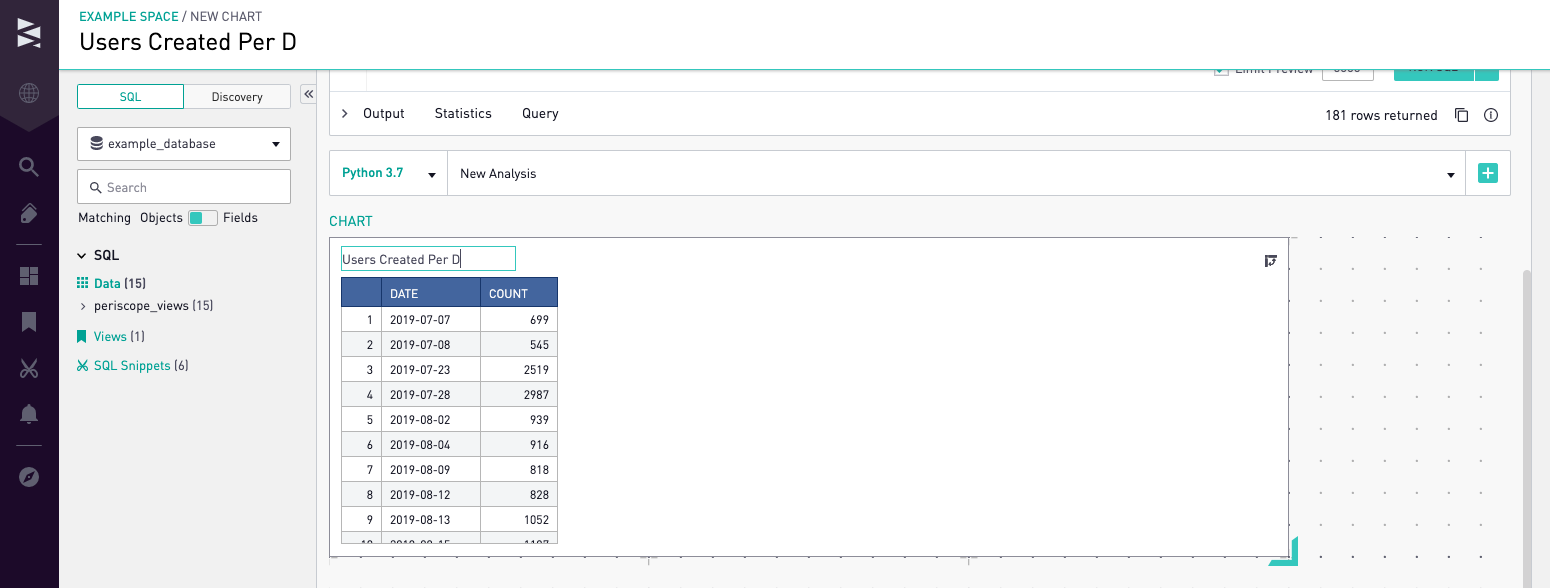
Type the query into the box and click "Run SQL".
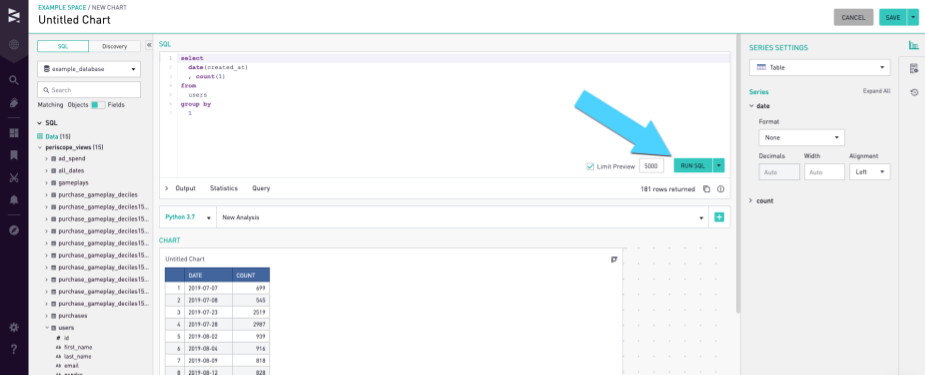
The results come back from the database in the form of a table.
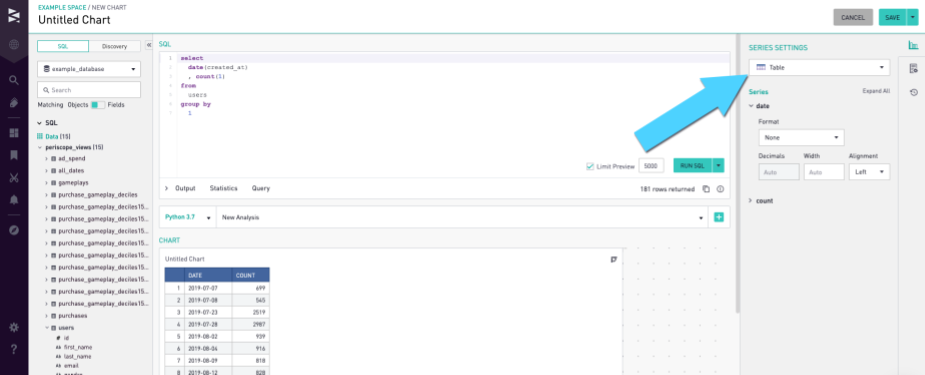
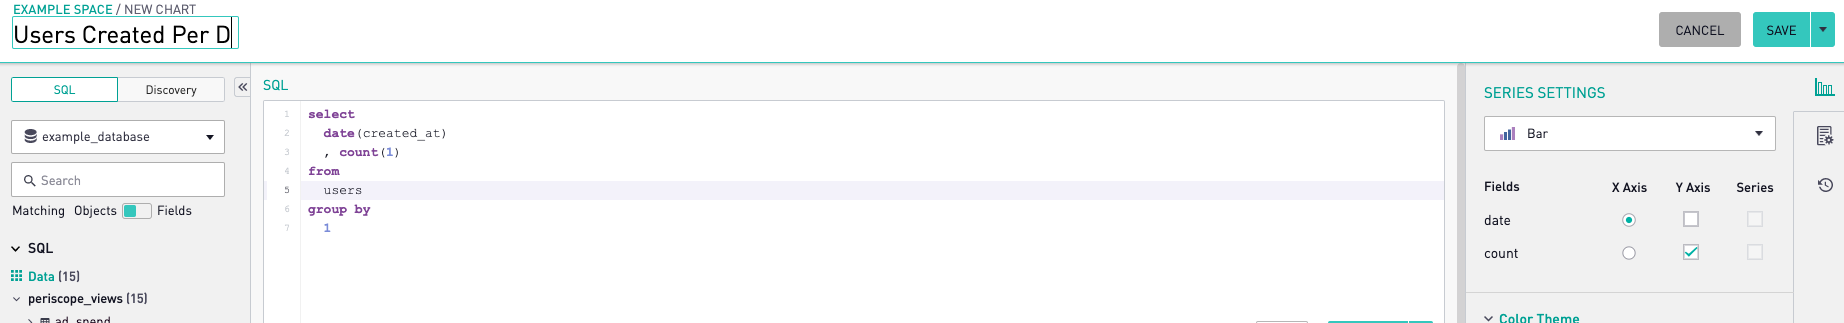
To create a visualization and change the chart type, click the chart type dropdown to the right of the SQL area.
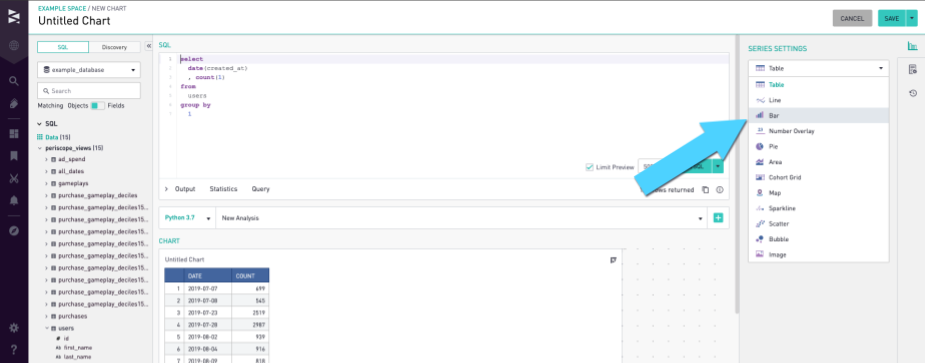
Choose from any of the available chart types. Chart type options include:
The options available in the series settings tab and chart format tab contain chart type specific settings. For more information, please see the documentation for that specific chart type, linked above.
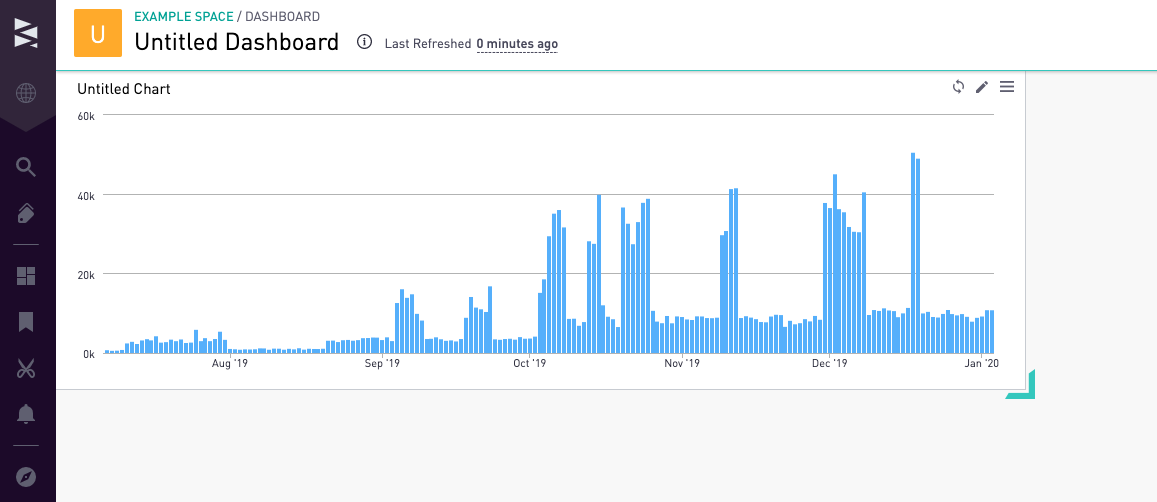
After choosing a chart type and various settings, click "Save" to place the chart on the dashboard.
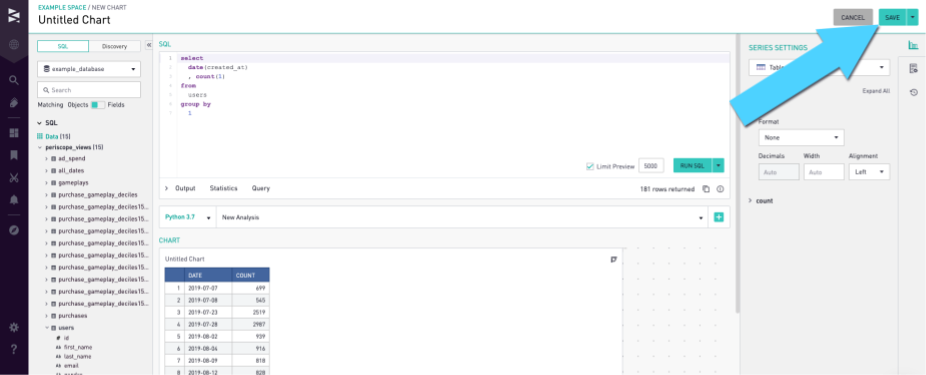
The chart then gets added to the top of a brand new dashboard, or to the bottom of a dashboard with other existing charts:
<a href="#top">Back to top</a>
<a name="ChangeTitle"></a>
Changing Chart Titles
To edit the chart title, open up the chart in edit mode through the pencil icon at the top right of the chart, and click on the chart title to begin typing:
The title can also be edited by scrolling down to the bottom to the chart preview and changing the title there:
<a href="#top">Back to top</a>
<a name="AddDescription"></a>
Adding a Description
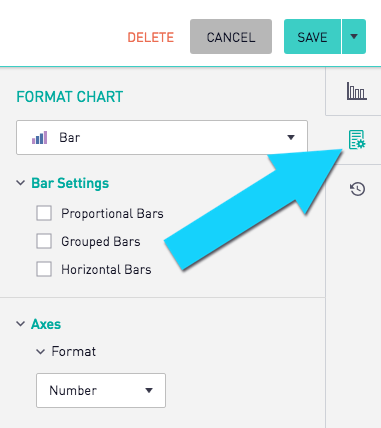
Adding a description can be done with any chart through the Chart Format tab. Scroll down to the Advanced section of the settings:
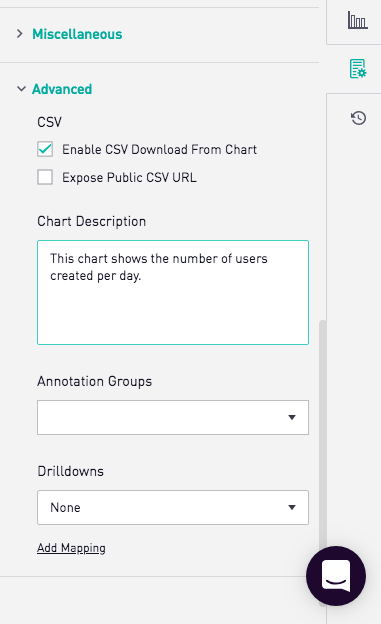
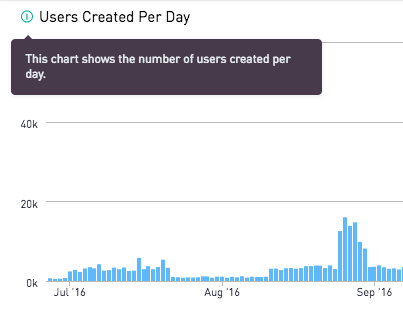
Once a description has been added, click outside of the text box to lock the description in place prior to saving. The description will show up when hovering over the top left corner of the saved chart:
<a href="#top">Back to top</a>
<a name="CopyData"></a>
Copying Chart Data
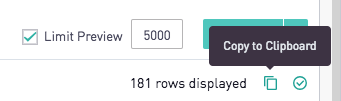
SQL Users can copy the underlying dataset by clicking on the "Copy to Clipboard" icon beneath "Run SQL". The data can then be easily pasted in a CSV format.
<a href="#top">Back to top</a>
<a name="DeleteChart"></a>
Deleting a Chart
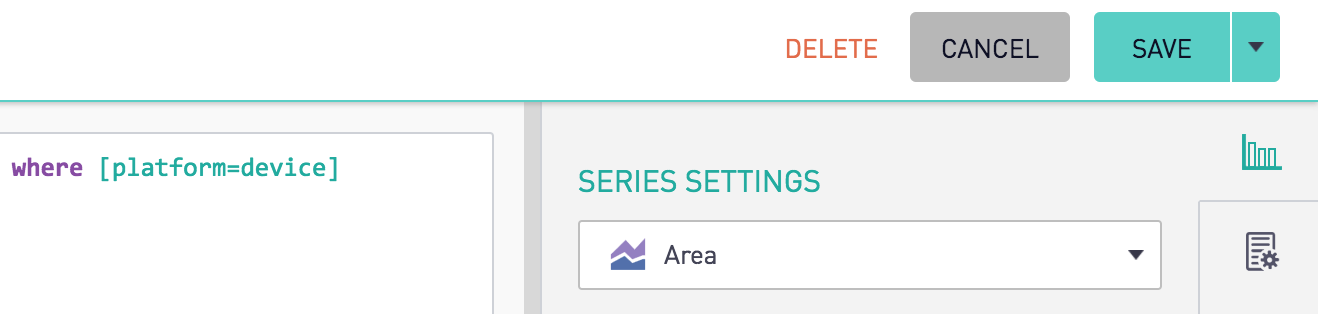
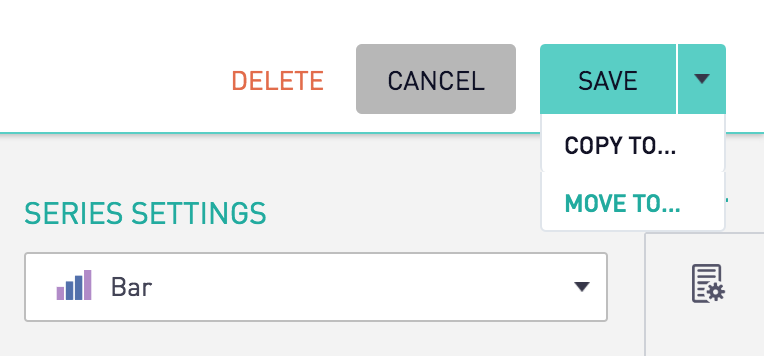
If a chart is no longer needed, it can be easily deleted in the edit view. Within the Chart Editor, click the "Delete" button in the top right corner:
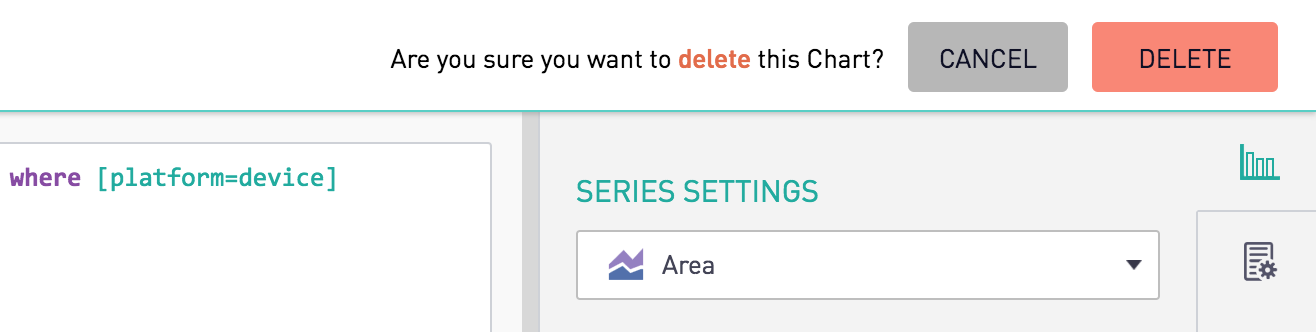
After confirming, this chart will be permanently deleted from the dashboard.
<a href="#top">Back to top</a>
<a name="CopyChart"></a>
Duplicating a Chart
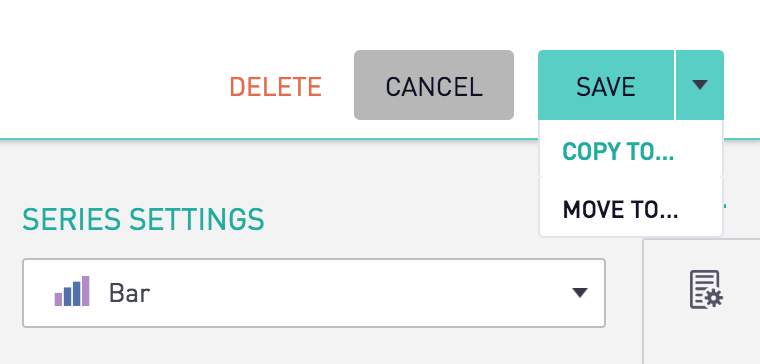
To duplicate a chart, open up the chart in the edit view. Click the down arrow next to the "Save" button at the top right of the screen and choose the "Copy To..." option:
In the pop up, a new name for the chart copy can be specified, as well as the dashboard it will be copied to. The "Save" button will save and navigate to the copied version of the chart.
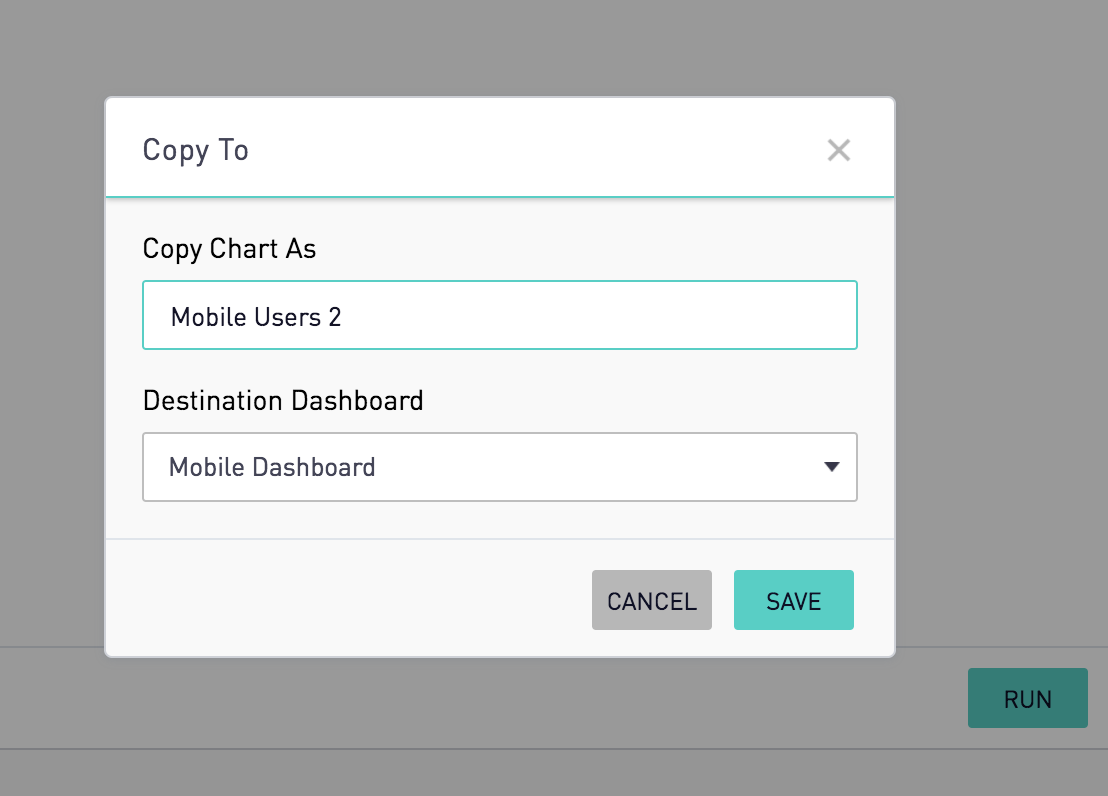
Any changes made to the chart will be preserved in the copy of the chart, but will not affect the original chart where the changes were made.
<a href="#top">Back to top</a>
<a name="MoveChart"></a>
Moving a Chart to Another Dashboard
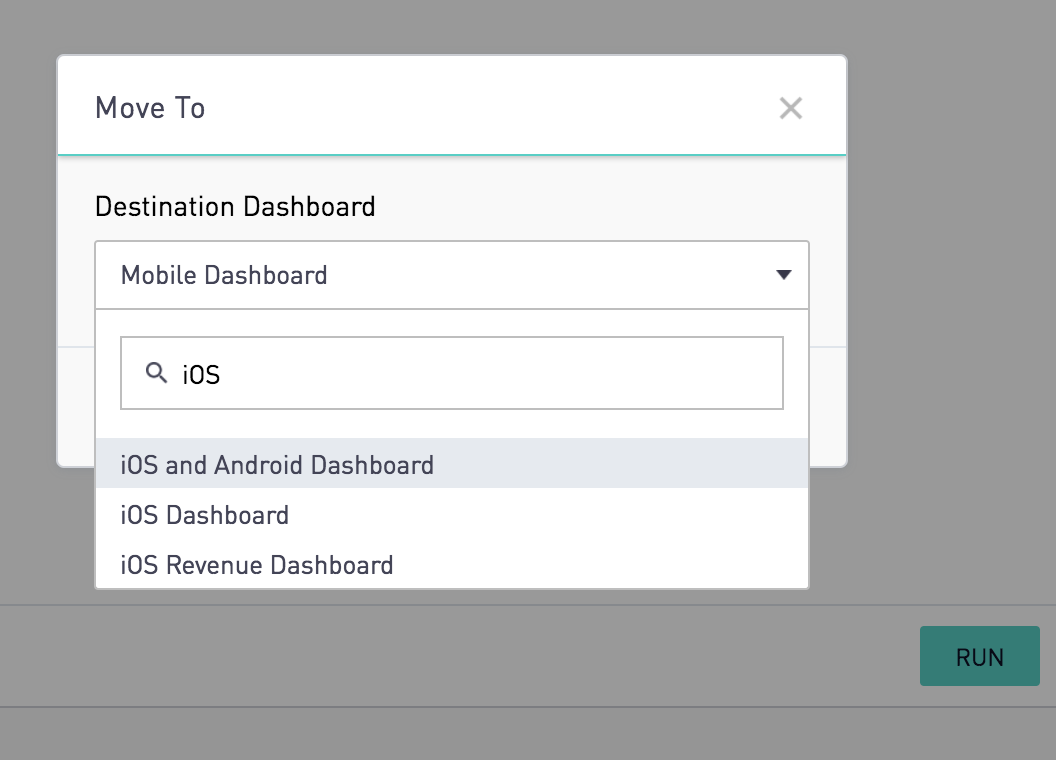
Migrating one chart to another dashboard can be done through the edit view of the chart. To change the dashboard that this chart resides on, click the down arrow next to the "Save" button at the top right of the screen and choose the "Move To..." option:
In the pop up, the new dashboard can be specifed. After saving, the chart will be moved to the newly selected dashboard.
<a href="#top">Back to top</a>
<a name="ChartLimits"></a>
Chart Limits
The number of rows returned by a chart's query is limited to 5000 by default. This can be adjusted by either entering a new number into the Limit Rows text box, or by writing a LIMIT or TOP clause into a query.
If a LIMIT or TOP clause is defined in the query, the row limit defined in the UI will not be applied to the query. Limits that are defined in the query will apply to the CSV downloads of a chart, whereas a row limit defined in the UI only applies to the visualization of the query.
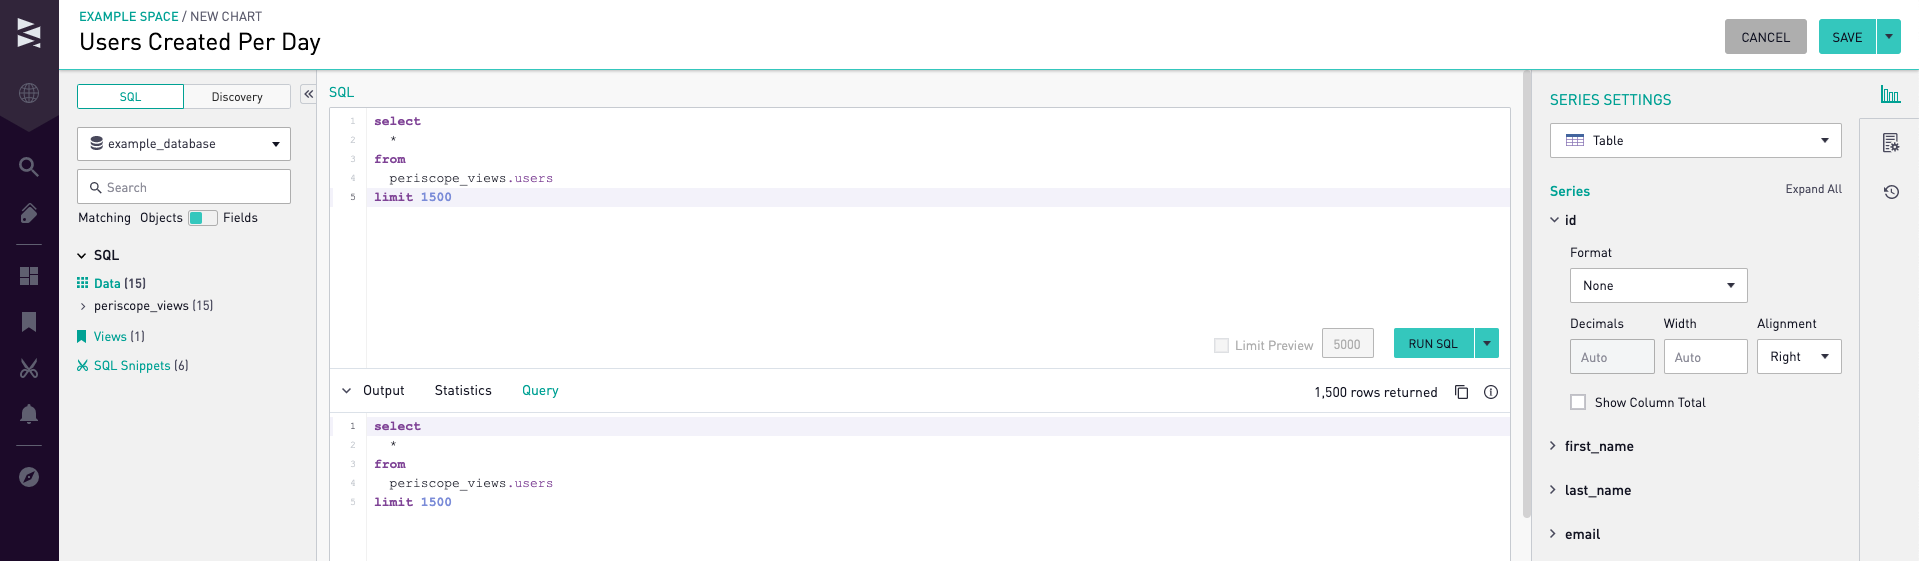
After the limit has been updated, the query will need to be re-run for the change to affect the results. If Limit Rows is unchecked, and there is no LIMIT or TOP specified in the query, the query will run without a limitation applied to the query.
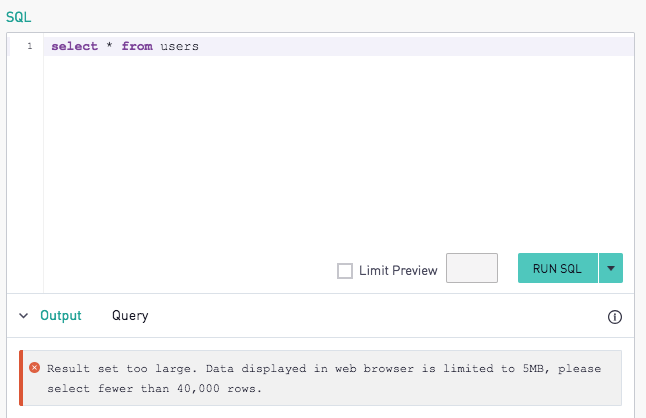
Note: Most browsers can only handle visualizations with up to about 4.7MB of data. If more than this amount of data is selected, the above error will show. Simply adjust the Limit Rows amount to a lower number. For more information on how the Limit Rows box works and how it functions in tandem with CSV Downloads from the chart, please see our documentation on CSV Downloads.
<a href="#top">Back to top</a>
<a name="CancelQuery"></a>
Canceling Query
To cancel a query running on a redshift database, in the chart editor, click the down arrow next to the "Run SQL" button at the top right of the screen and choose the "Cancel Query..." option:
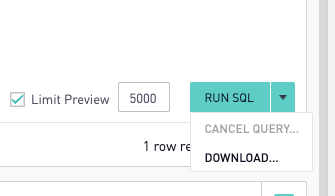
Note: This option is only for queries run on a redshift database.
Looking for More?
Try our other documentation pages for guidance on topics like:
- Chart Options
- Schema Browser
- R and Python Charting
- Version Control
- Chart Annotations
- Data Discovery
- Public CSV URL
- Drilldowns
- CSV Downloads
<a href="#top">Back to top</a>