Dashboard Refresh Management
👤 This documentation is intended for Site Administrators on instances with the Dashboard Refresh Management feature. Site administrators can contact their Customer Success Manager if interested in enabling Dashboard Refresh Management. For an overview of default Sisense for Cloud Data Teams Dashboard and Chart Refresh Mechanics, refer to the documentation here.
Dashboard Refresh Management allows admins to schedule when dashboards should be automatically refreshed and when the 'Refresh All' icon on dashboards should be disabled.
Note: Dashboard Refresh Management is an add-on feature. Site administrators can contact their Account Manager for additional information.
Overview
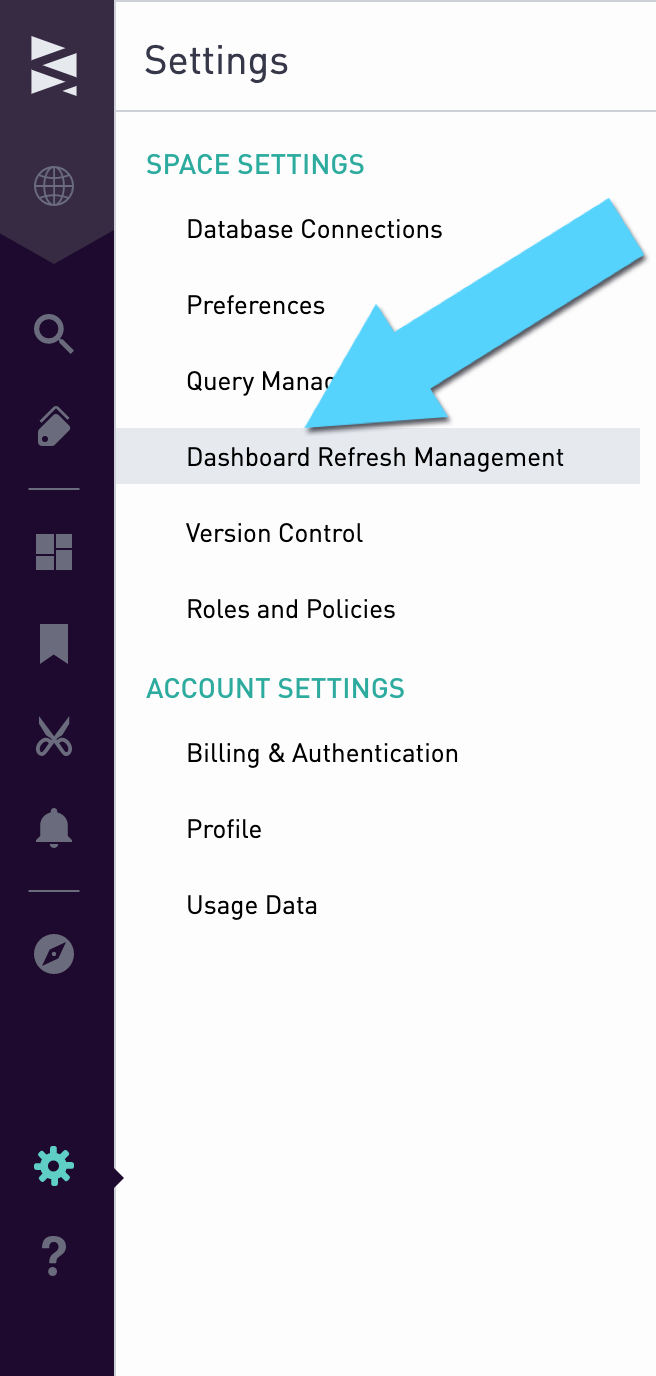
To open Dashboard Refresh Management, first click on the Settings menu at the bottom left hand navigation bar. Then, click on Dashboard Refresh Management.
Setting Site Default
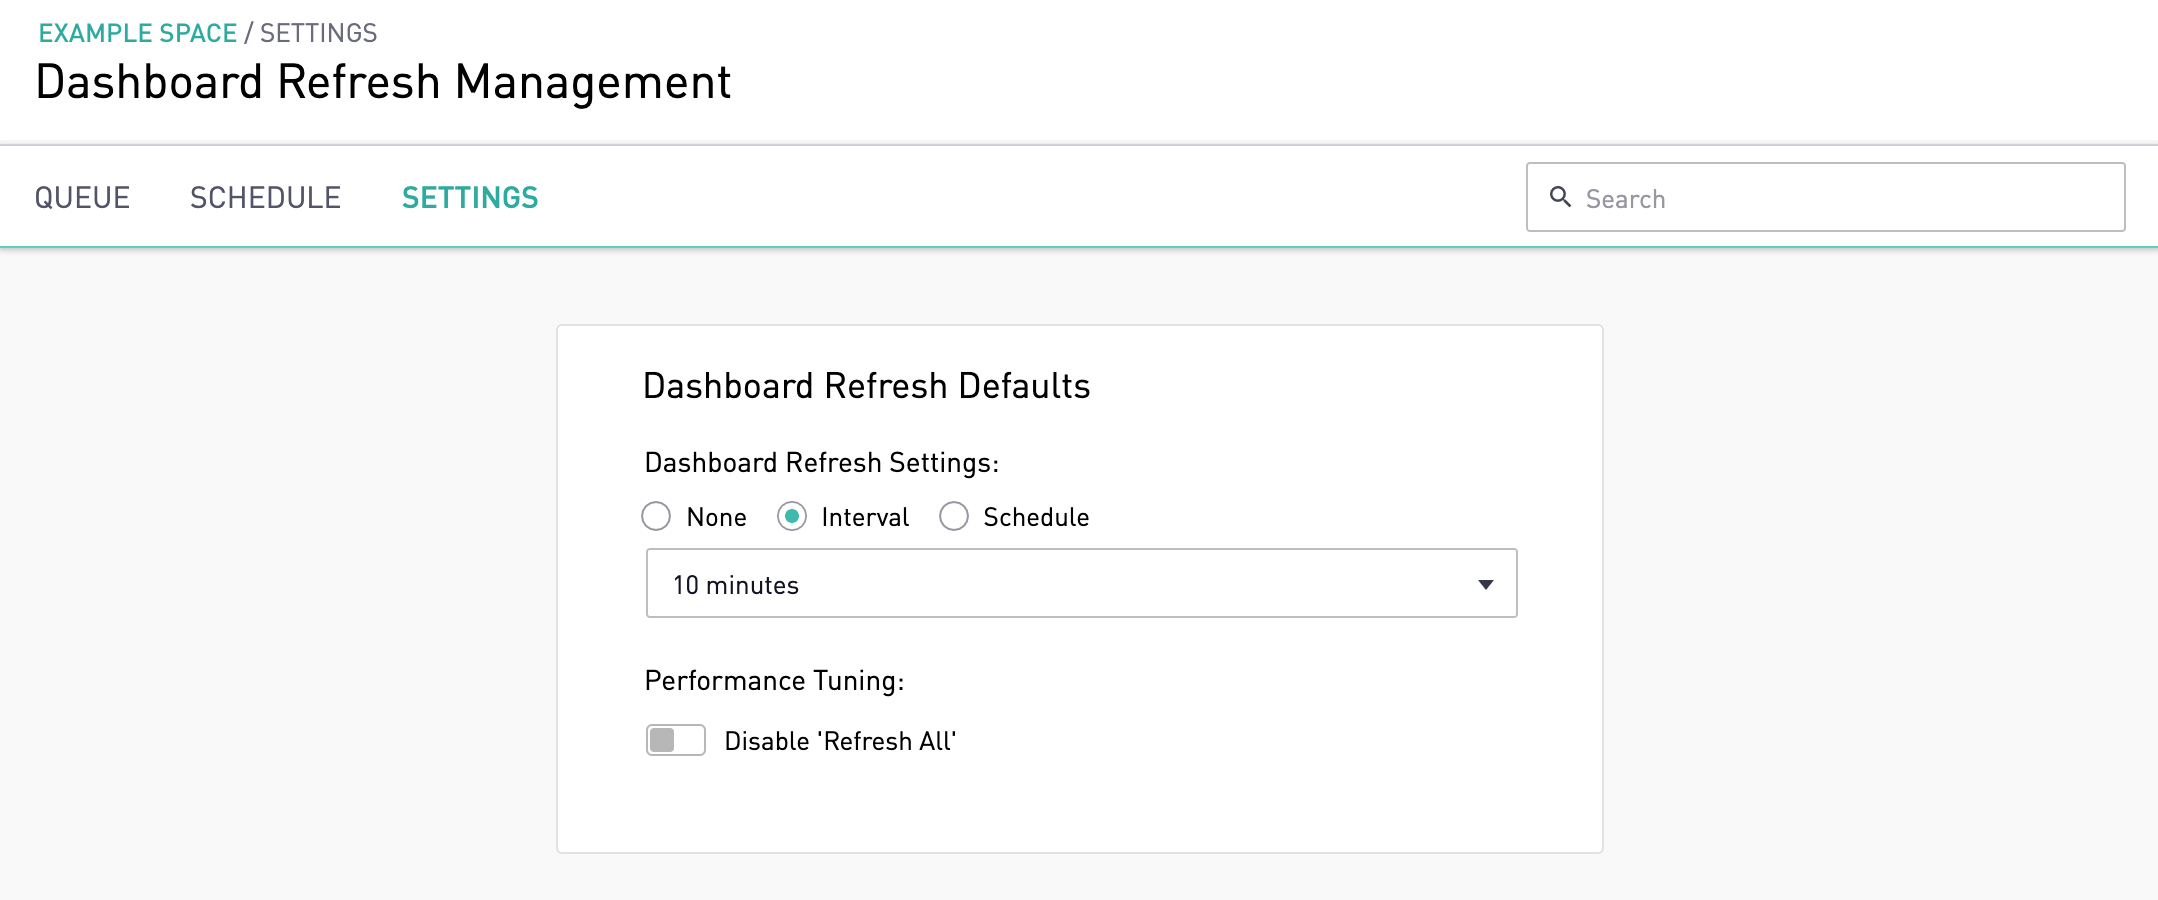
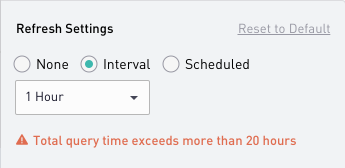
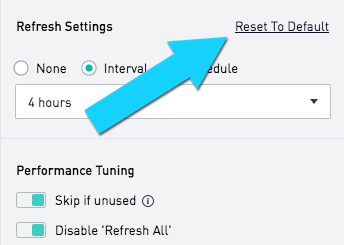
In the Settings tab, admins can set the default Dashboard Refresh settings for all dashboards. Admins can choose between setting no automatic refreshes, setting refreshes at an interval (e.g. every six hours), or setting refreshes at a specific hour every day (e.g. every day at 8am)
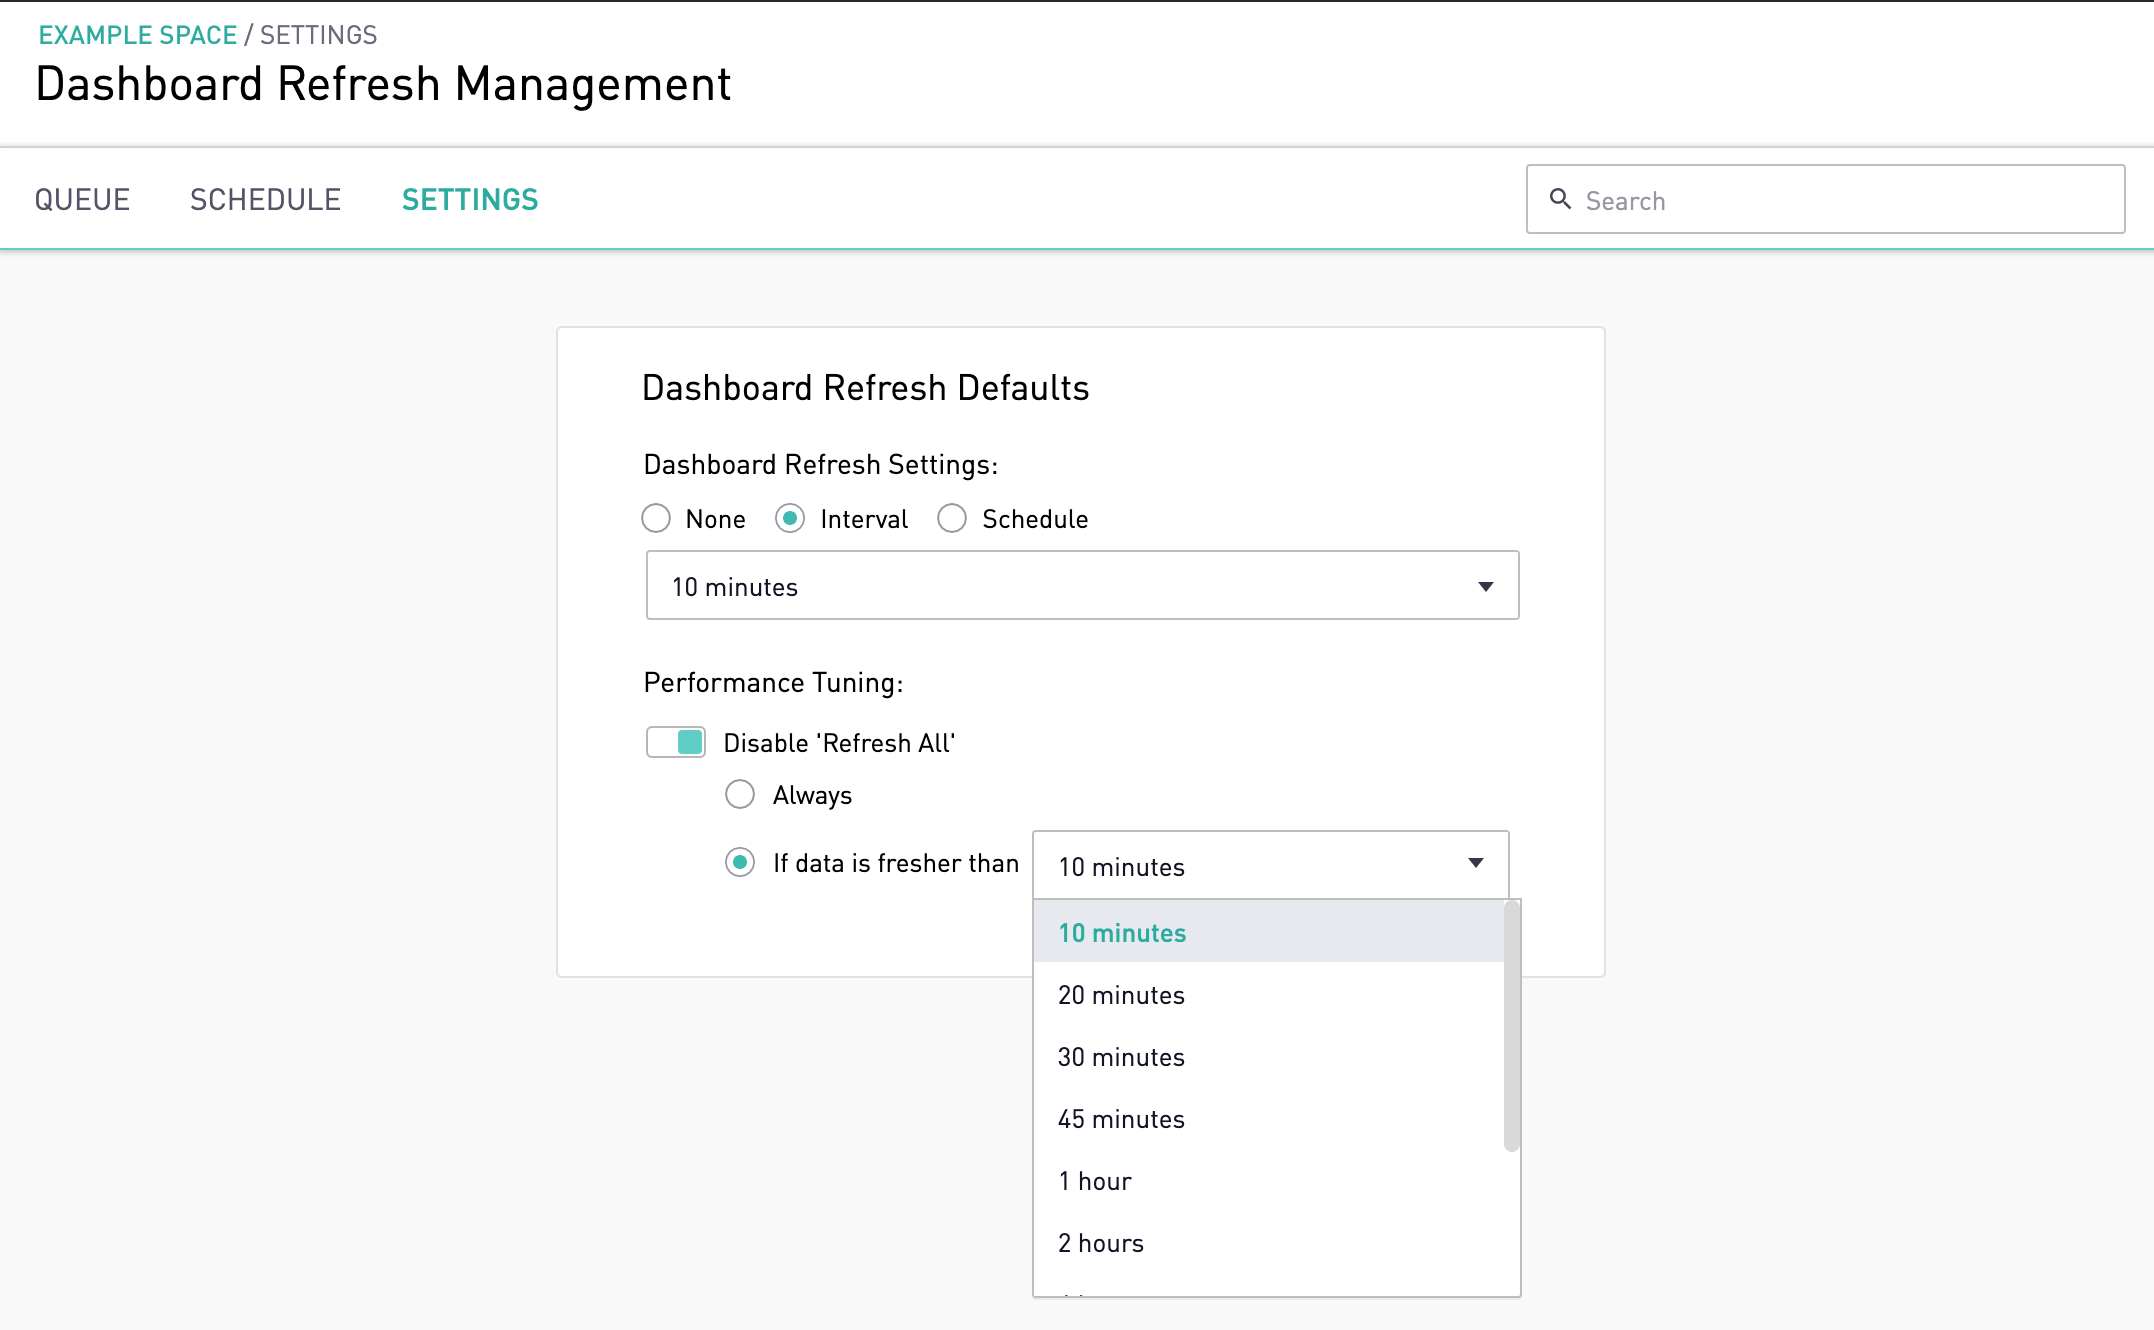
Admins can also choose to disable the 'Refresh' icon on the dashboard when the data has been refreshed within an allotted timeframe. For instance, in the example below, all dashboards that have been refreshed within the last hour will have the 'Refresh' icon on the dashboard disabled.
Configuring Custom Dashboard Refresh Schedules
Admins can then navigate to the 'Schedule' tab within Dashboard Refresh Management to schedule custom dashboard schedules and settings.
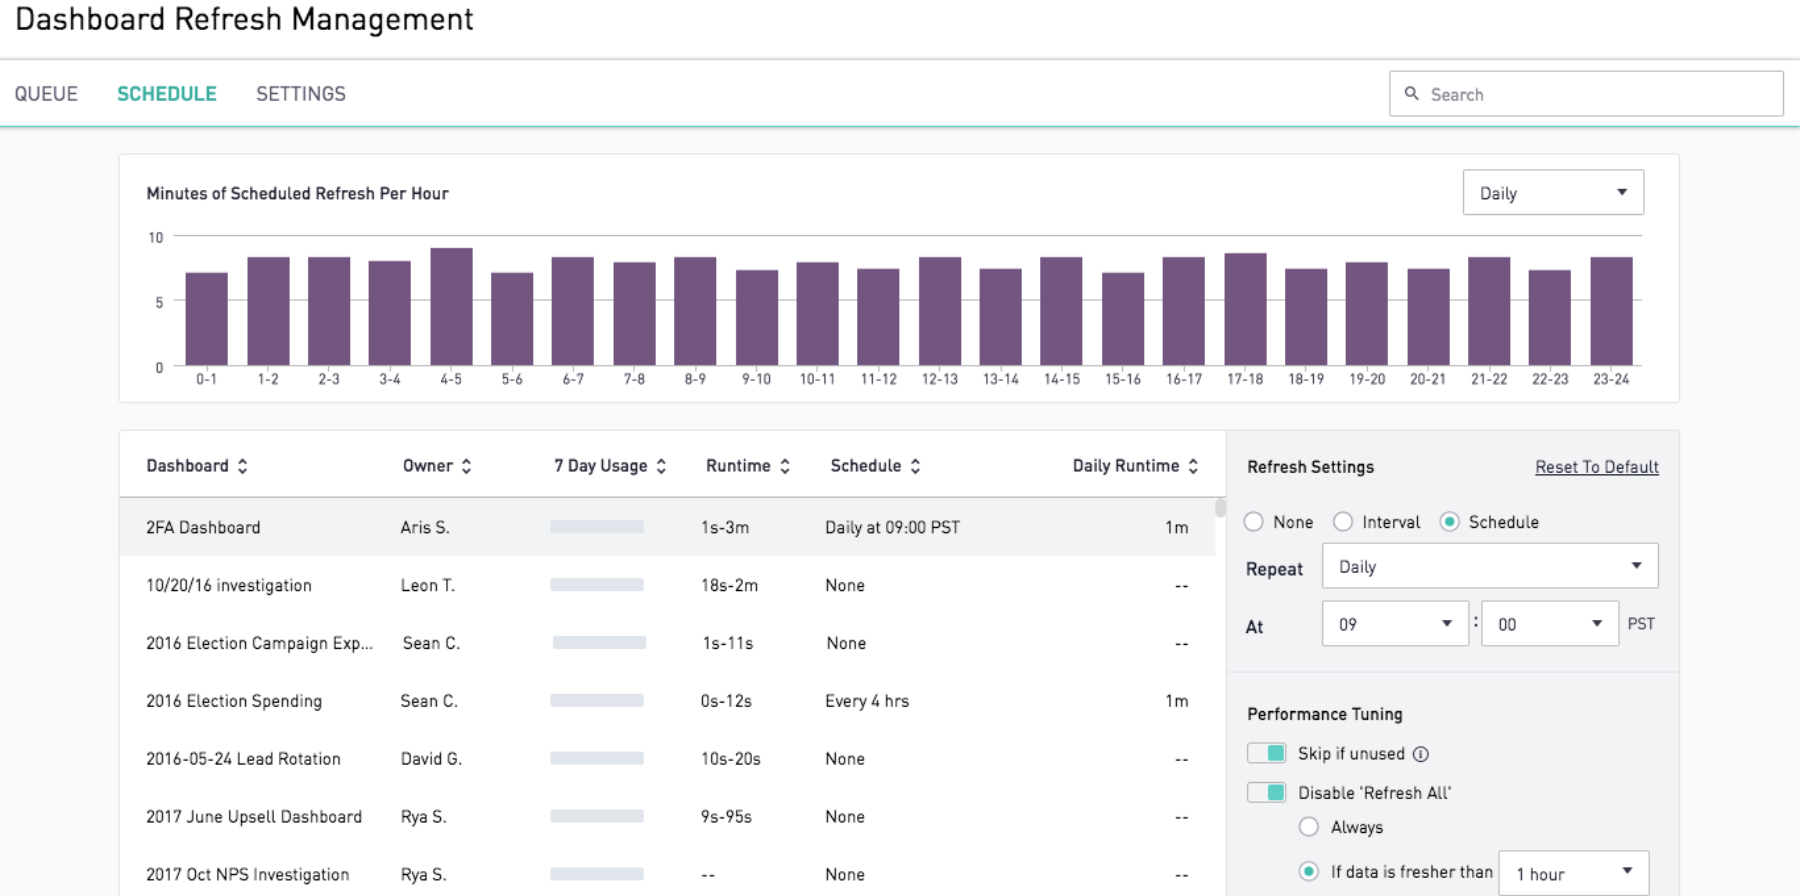
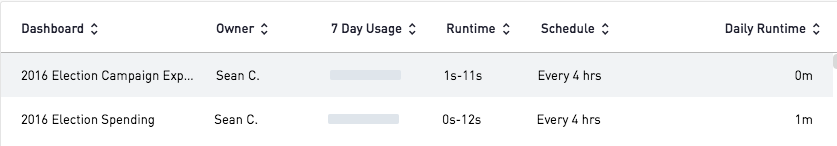
This screen will display all dashboards in the site and their refresh settings. Dashboards will automatically refresh or disable the 'Refresh' icon according to the default settings configured in the Settings menu. To customize the schedule, admins can click on the dashboard they'd like to update and select a specific refresh setting for this dashboard.
Under Performance Tuning, admins can choose to skip refreshes on unused filter sets by selecting 'Skip if unused'. This would skip scheduled refreshes for filter sets that have been been viewed for less than 10 minutes in the last 7 days. Admins can also adjust the freshness condition for disabling the refresh icon on the dashboard.
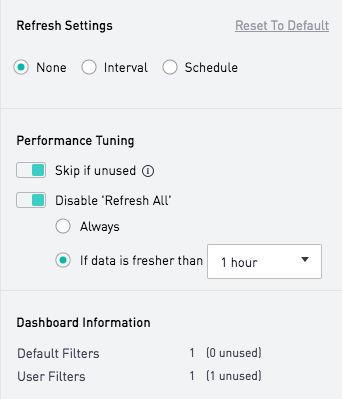
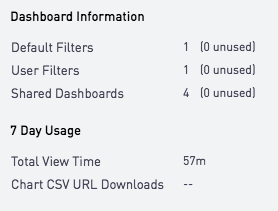
Dashboard Information
When a dashboard is refreshed, all versions of its filter configurations will also be refreshed. If a user has a unique filter set applied for a dashboard that varies from the default filter, this will be counted as a separate dashboard listed next to User Filters. Shared dashboards with unique filter sets will also be counted as separate dashboards and additional refresh jobs.
The count of unique filter sets that have not been viewed for more than 10 minutes in the last 7 days is included to the side. This is the number of filter sets that would not be refreshed should the 'Skip if unused' option for the dashboard is enabled.
The Runtime displayed in the Dashboard Refresh Management screen will be the sum of the runtimes of all unique filter combinations.
If the sum of all scheduled runtimes exceeds 20 hours, a warning label will be displayed. Admins are encouraged to optimize this feature by setting more frequent intervals for more important dashboards and either turning off automatic refreshes or setting less frequent intervals for less viewed dashboards.
Admins can revert to the default dashboard refresh settings by clicking on 'Reset to Default'.
Capacity Chart
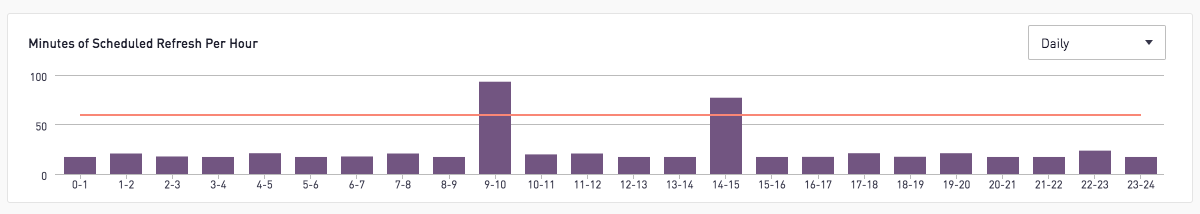
Admins can view the total amount of refreshes scheduled on a daily, weekly, and monthly basis. The threshold is indicated by the red line in the capacity chart. For example, in the daily view, the threshold is 60 minutes of refreshing for each hour. If the sum of refresh runtime in an hour exceeds this threshold, that signifies that the refreshes will fall behind schedule.
Queue
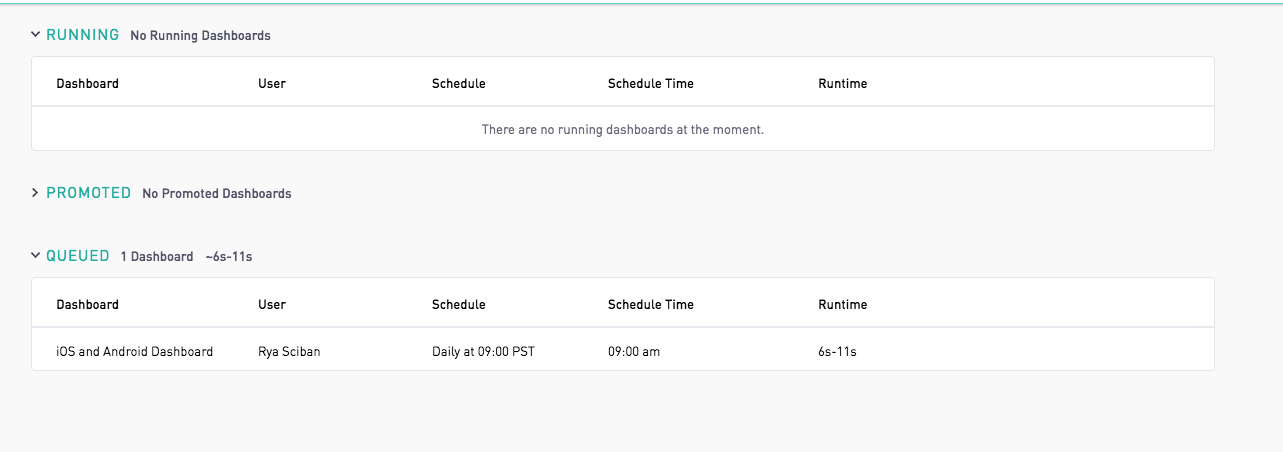
Users can also view the dashboard refresh activity by clicking on the 'Queue' tab in the header. Here, dashboards that are queued for a scheduled refresh will appear. When there are several dashboards queued simultaneously, admins have the option to promote one over the others to prioritize their refresh.
When dashboards are delayed from the preset refresh schedule, a red text will outline the time delay.
Transitioning to Dashboard Refresh Management
For best practices transitioning to Dashboard Refresh Management, please refer to this helpful documentation here.