Warehouse - Dependency Map
👤 This documentation is intended for SQL Users using Sisense's Managed Warehouse Infrastructure option. Site administrators can contact their Account Manager if interested in enabling the Sisense Managed Warehouse. The Sisense Managed Warehouse Infrastructure is only available for the Amazon Redshift Infrastructure.
Sisense Managed Warehouse customers have access to a full dependency graph for any of their views. This is a great way to get additional information necessary to understand the impact of any edits made to the important views, CSVs, and tables that have been built or stored in the warehouse.
Dependency Map Tab
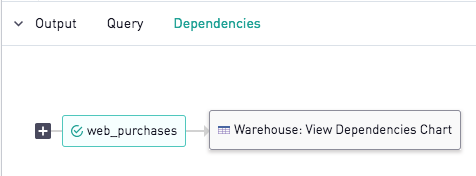
To access the dependency graph for a specific view, open the view and make sure that Warehouse is selected in the database drop-down in the upper-left.
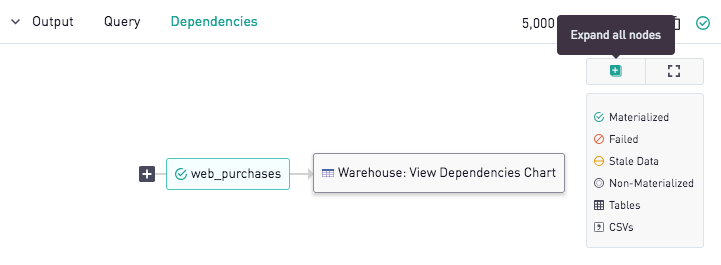
In the preview pane, select the DEPENDENCIES tab. If no graph is displayed, run the query to generate it.
Once the dependency graph has been created, the user can click and drag to navigate around the graph. If the "+" box is clicked, additional parts of the dependency hierarchy will be displayed.
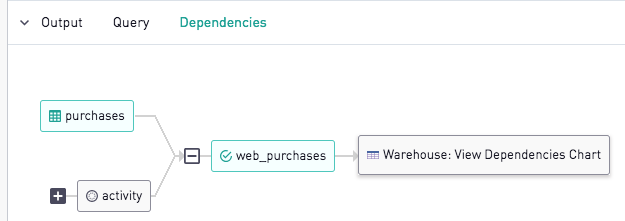
Users can expand the entire dependency map by clicking on the "Expand All Nodes" icon at the upper lefthand corner of the legend.
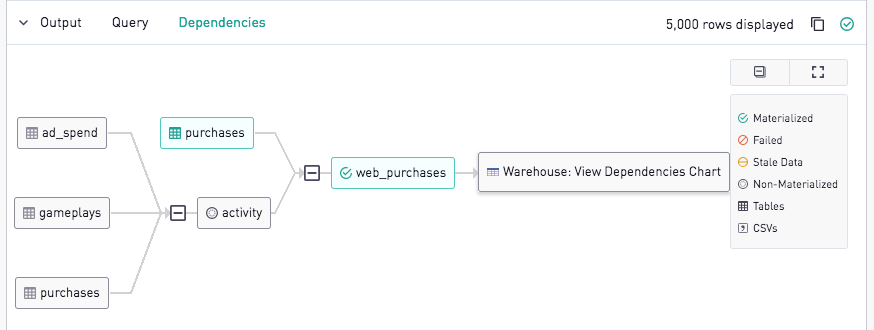
This expansion will display the entire dependency map related to the view:
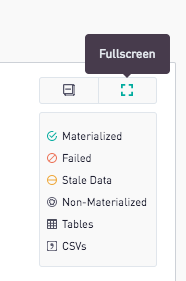
To see an enlarged view of the map, users can then click on the "Fullscreen" icon on the upper righthand corner of the legend.
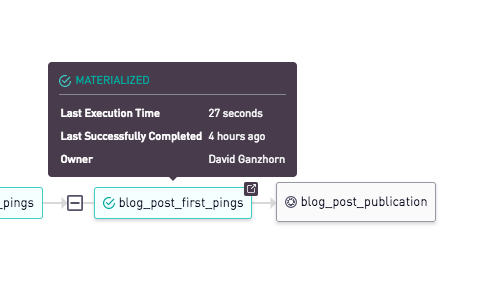
Users can also easily navigate to another view within the map by hovering over the name of a view and clicking on the arrow icon in the upper righthand corner of its label. The view will open in a new tab on the browser window.
Dependency Map Features
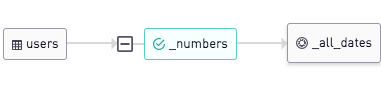
Dependency Maps show all of the relevant connections that are used to materialize a view on the cache. The nodes of the graph represent individual tables, views, and CSVs. Each of the nodes indicates a different type of dependency that must be considered when evaluating the scope of any warehouse table changes.
Materialized Views

The green checkmark and highlighting of a node indicate a successfully materialized view. These are tables that have transformed other data sets and been stored in the Sisense Managed Warehouse. For more information on how to materialize a view, see Materialized Views.
Unmaterialized Views

Views that do not meet the qualifications to materialize or that are not set with "Materialize View" enabled will be represented as a gray box with a circle on the left. These views can also have dependencies but will not exist as physical tables on the warehouse.
Failed Materialized Views
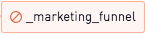
A red box with a red circle indicates a view that failed to materialize on the warehouse. This view was set with "Materialize View" enabled but did not have one or more of the criteria met to materialize the view fully. The view will be treated as an unmaterialized view when referenced in a query or the dependency graph. To get the view to properly materialize, reference the guidelines in Materialized Views.
CSVs
When a user uploads a CSV, it is stored in the Warehouse and able to be used as a table when creating queries and views. As such, they are often a source of data for view dependency. To indicate that the node represents a CSV, a gray box with a comma in it is displayed next to the CSV name. For more information on CSVs, please refer to our CSV documentation.
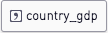
Tables

The parent node of many views will be a table, displayed with the common table icon in a gray box. Only tables stored in the warehouse will appear in the dependencies graph.
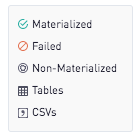
All of this information is rolled up into the legend of the view dependencies graph.